- Layout files can be created for specific workstation names just like the Usersettings.grf files. Save the layout file with the name [workstation]_Picture.layout and it will only be applied to the matching workstation name. The workstation name restrictions are the same, so no dashes are allowed and use underscores with care as they tend to prevent customized user settings files from loading. You also won’t want to start a workstation name with a number even though DeltaV will allow it in DeltaV Explorer.
- If you have any errors in your layout file the entire file will be skipped. If what you get isn’t even close to what you expected there is probably an error and the default layout file was used instead.
- A custom layout file overrides settings that are common between the layout file and the user settings file. Since the layout file specifies initial graphics, toolbars and alarm banners the ones that load are those in the layout file, regardless of what is in the user settings file.
- In a multi-monitor system the layout file can be used to change what monitor is used for what purpose. For example, in a quad-head system monitors are numbered 1 through 4 by the operating system. The default layout makes monitor 2 the primary display (behaves the same as a single monitor system) and monitor 3 the secondary display (behaves like the second monitor on a dual-head system). Monitors 1 and 4 are defined as “user” monitors and are pre-defined for alarm list and alarm filter graphics by default. To rearrange the monitor usage without changing cabling (some furniture makes it difficult to get to after everything is installed) you can change the [MonitorAllocation] section (commented out initially).
- To add an additional picture to the layout definition you must make three changes. First, change the value of “Count.” This is the total number of pictures that are defined in the layout file. Don’t forget to decrease the value if you remove a picture. Second, add a “Picture#=” line that has the relative path to the graphic and graphic name without the extension. The base path is assumed to be the Pic folder of the workstation. Third, add a section that has the relative path and graphic name inside square brackets. This section will have entries for the screen, picture type, upper left corner position (X & Y coordinates), height and width.
- Easy trip-up prevention tip – if you change the picture name in the “Picture#=” line, don’t forget to change the name farther down in the file where the name is in square brackets.
- Picture height and width values don’t have to match the actual graphic that will be displayed. The graphic will stretch/shrink to fit the defined space reserved by the height and width numbers unless that functionality has been disabled for the graphic. This will require some testing to make sure all the displays you have defined or that may be switched to will appear correctly in the reserved area.
- Picture widths may not be what you expect. On a test system at 1920x1080 resolution, the alarm banner and toolbar widths needed to be set to 1914 instead of 1920 to display without extending onto the other display. Test often and try making minimal changes between tests.
Thursday, October 15, 2009
DeltaV in HD
Thursday, October 1, 2009
Going Bolding at Emerson Exchange 2009

So for the first time in a process automation system, there’s a tool to monitor the quality and predict the endpoint of a batch based on a PCA/PLS developed model. He implemented a really cool technique call Dynamic Time Warping (beam me up, Scotty) which is based on logic used in voice recognition software to remove the time variation in batch to batch runs in developing the models.
Through a presentation layer making use of Microsoft Silverlight, operations and engineering personnel can then monitor, via Internet Explorer, the progression of a batch in real time and not only identify deviations, but quickly determine if the variations will effect the overall batch quality based of critical quality parameters.
Monday, September 28, 2009
Emerson Exchange 2009 – Charming


Sunday, September 27, 2009
Emerson Exchange 2009 Preview
I don’t want to steal any of the thunder about what folks are going to see tomorrow from Emerson, but I thought I’d a least post the updated DeltaV logo:

More to come from Exchange over the next several days – stay tuned…
Monday, September 21, 2009
Numatics/DeltaV Integration
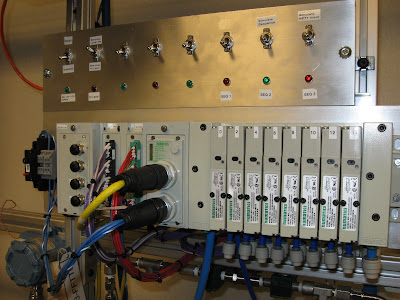
We have it connected up on one of our DeviceNet segments and have one of the solenoids connected up to a Crane Saunders diagram valve with a conventional switchpack. We used our standard valve module template in DeltaV, but instead of the output going directly to the solenoid, it goes to a register input within the Numatics.
We then constructed some logic, using function blocks available in the Numatics, to provide local interlocking based on another discrete input (a make-believe tank high level switch). One more switch allows us to turn the Numatics logic on and off, so comparisons between it and DeltaV can be demonstrated.
This puppy if FAST. I’m in the process of putting together a video I hope to upload to the Process Automation Usability Project website sometime after Emerson Exchange. We also constructed a valve sequence within DeltaV and ran it as fast as we could, simulating the valves around the bowl of a centrifuge. We then put the same logic in the Numatics and using another register, triggered the sequence from DeltaV. We actually had to slow the sequence in the Numatics down just so we could see it!
Friday, September 11, 2009
I have, on the other hand, been following a few folks to try and figure it out and hopefully pick up some useful information – honestly, I’m not just lurking.
Along with my engineering and management responsibilities, I dabble on the sales side of automation and have been introduced to the concept of the “elevator talk”. Either Jim Cahill or Mike Boudreaux, on one of their recent twits (is that what they're called?), provided a link to a blog (which provided another link to another blog) on the topic of the “customer’s elevator rant”, a prequel to the elevator pitch. It’s very enlightening, and a must read in preparing for the upcoming Emerson Exchange.
Hey, good news – in getting the hyperlinks to include in this post, I think I’ve made a small breakthrough in my twitter adventure. Maybe I’m not too old for this stuff after all. Ready to check me out - click here.
Wednesday, September 2, 2009
Data View Web Part, Part II
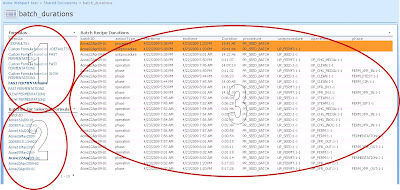
So we’ve put together a really good Batch Duration example. It’s a combination of 3 data view web parts, feeding each other in series. The first data view allows the selection of a formula, which populates the second data view with a list of batches that meet the formula criteria. By clicking on a particular batch id then populates the third data view showing durations. We even took advantage of the web part to highlight durations that exceed a fixed amount of time. Great for doing batch to batch comparisons.

Wednesday, August 19, 2009
Data View Web Part
In the screenshot below, I’ve used the web part to display data from a stored procedure, showing recent batches run on our demo system. The web part has the ability to highlight values or whole rows based on expressions. In this case, I’ve highlighted batches whose duration has exceeded a predetermined limit. Makes it easy to quickly identify the outliers.
Of course, it would be really neat if I could just click on the Batch ID in the list and get access to a report or launch a tool like History Analysis…
Monday, August 17, 2009
SharePoint As An Automation Dashboard
SharePoint is SQL based, so it’s SQL aware, almost SQL friendly. And since DeltaV has lots of stuff stored away in SQL (batch data, Syncade data, alarms and events data), this seemed like a good place to start.
First thing though, you’ve got to have Microsoft Office SharePoint Designer. The good news, it’s now free from Microsoft (Bill Gates must have been feeling especially generous one day). Click here to follow the link to the download site. You’ll want to get a good book on Designer and SharePoint (I’m still looking for one).
The specific tool we’ve been experimenting with is the data view web part. So to get a summary of orders from Syncade, you create a data source into the DMI_EBR database, looking at the vOrders view:
Thursday, August 6, 2009
A Prolific Comment
When a pharmaceutical company representative remarked “We’re awash with data, but we have no information”, Alison Smith of Aspen Technology she commented “this was a very apt statement. It applies to any environment in which technology has been deployed in the absence of an information design…”
Data to information, information to knowledge – a holistic approach to the application of S95 is key to keep all those thousands of terabytes of data from gathering electronic dust.